Photometric lighting isn’t just a type of lighting or a design style – it’s the study of light itself and how it emanates from a fixture into the environment. It’s required knowledge for anyone that works with fixtures and, fortunately, not something that home or business owners need to worry about. But any lighting designer worth their reputation will make thorough use of photometric maps to diagram a lighting project, as no other method is as detailed or precise.

A Measured Approach
Lighting is something that people feel, that they perceive almost without thinking. It may seem, then, that lighting designers work with fixtures by feel. While experience certainly breeds familiarity, reputable firms don’t just rely on their intuition to piece together a complex lighting project. Photometric data provides an objective, reliable way of mapping out a field of fixtures and ensuring that the client gets exactly what they are asking for.
But how exactly do lighting experts use photometric data? To get the full picture, we have to bring in the Illuminating Engineering Society of North America (IESNA) and the goniophotometer.
Lighting the Way

In 1986, the IESNA released their IES file format for photometric data. It’s not exactly the kind of breakthrough that excites the general public, but it was a massive relief to designers and installers. The IESNA archive contains hundreds and hundreds of photometric maps, each formatted into an IES file that lighting experts can read with specialized software. With the introduction of the IES file, lighting experts everywhere could quickly reference any fixture and determine which would work best for their project. No need to stick lamp after lamp into the same socket.
But what makes an IES file so valuable to a designer?
Goniophotometer, a Big Word for a Simple Device
IES files contain two important values – a fixture’s luminous flux and its luminous intensity. Together, a designer can use these values to determine a fixture’s lighting pattern. Specifically, this is what the terms mean:
- Luminous flux – refers to the total amount of light that a fixture emits, adjusted for how the human eye perceives the light. In other words, it’s possible for a fixture to output a lot of light, but light that is not easily perceived by the human eye. Luminous flux controls for this, effectively detailing how well a fixture generates perceivable light.
- Luminous intensity – refers to how much light a fixture throws in a particular direction, or angle. For example, it’s possible for a light to output a great deal of light, but not evenly, so it will appear dimmer from certain angles.
With these two variables, a lighting designer can determine how a certain fixture will look in any setting, and IES files are made to hold this data.
Clearly, IES files and the software that read them are essential tools to lighting experts, but how is this data generated? One word – goniophotometer. It’s a big word, but it’s a simple piece of technology. It really only refers to a tuning frame that holds the lamp, rotating it at regular intervals so that a light meter can automatically measure it and send the data to a specialized piece of software. Once all angles have been measured (and this takes hundreds of measurements), a map of the fixture is drawn up, offering a graphical representation of its performance.
What Does That Mean for Lighting Firms?
It goes without saying that if a client could see what the fixtures could do before being installed, it would help that client make a decision. It also goes without saying that the ability to diagram a project would greatly reduce guesswork and wasted effort on the part of the lighting designer. Photometric data makes both of these possible.
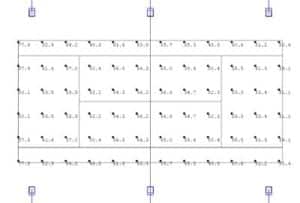
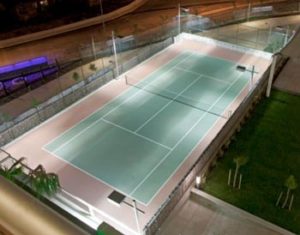
Using photometric diagrams, which are generated in special imaging programs, a lighting designer can create a 3D model of a set of fixtures. Each fixture uses the IES data to accurately display how it would appear in a parking lot, an industrial complex, a commercial center, a large building, a residential property, a museum, a gallery, or anywhere else a collection of fixtures might be needed to light an area.
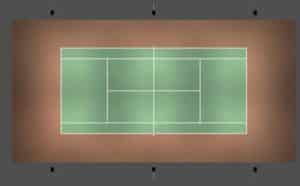
A lighting designer may produce several photometric images to give their client as much detail as possible into the project. A 3D model accurately shows each fixture’s transitions from light to dark, demonstrating where lighting is likely to collect and where darker spots may exist. In addition to the 3D model, a designer may also produce a bird’s eye view of the property, mapping each fixture over it and drawing out each fixture’s range. This will give the client a precise idea of how far and in what direction each fixture will emit light.
The Importance of Photometric Design
It may not be immediately clear just how different fixtures can be in terms of their luminous intensity. One line of thought might be – “just crank up the wattage to overcome any dead spots.” Besides the obvious problems of such an approach – namely, that burning extra watts costs money and runs the risk of putting out too much light, which may be forbidden by local lighting ordinances – there can be dramatic differences between fixtures in their lighting patterns.
Take, for example LED lighting. LED lighting is quickly replacing high pressure discharge lamps and metal halides in larger scale applications like parking lot lighting. However, there is a significant difference between LED and discharge lamp luminous intensity. Whereas discharge lamps and metal halides produce radiant illumination, or illumination that travels in all directions like a globe, LED fixtures produce strong directional illumination and do not emit in a radiant pattern. This makes for additional challenges and additional benefits when installing LED fixtures, but most importantly, it has a major effect on how photometric diagrams are produced when using LED technology.
Accounting for these subtle (or not so subtle) differences is what makes photometric concepts and drawings so important for a lighting project of any size. But it is a must for projects that demand precise lighting for security or efficiency reasons. And an experienced lighting firm will be able to provide cutting edge photometric concepts for its clients.


